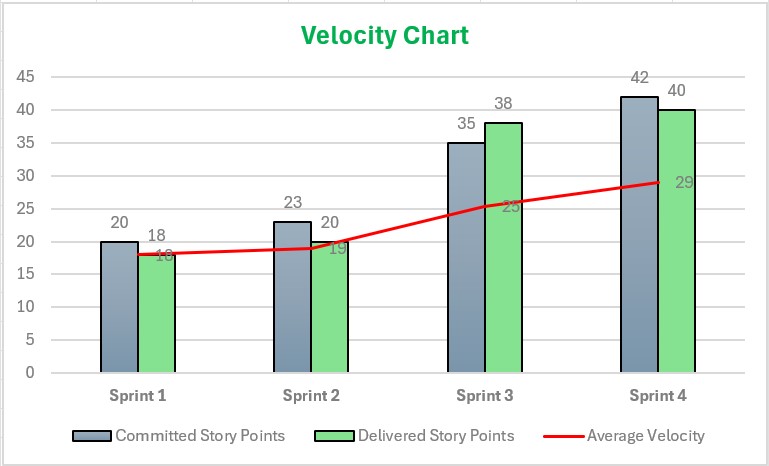
A Velocity Chart helps teams monitor and assess their delivery consistency over multiple sprints. It tracks the amount of work (measured in story points) completed in each sprint, which aids in understanding the team’s capacity. By comparing velocity across sprints, teams can better predict future performance, improve planning accuracy, and identify trends or fluctuations in productivity. This chart is particularly useful for refining sprint commitments and ensuring a steady flow of deliverables. It’s important to focus on long-term trends rather than single sprint outcomes to avoid overreacting to short-term variations.